As a digital marketing company that focuses on search and social media management in Singapore, we spend a fair amount of time preparing and analysing reports and Facebook metrics for our clients.
We have standard social media reports that are suitable for most clients but we are also able to customise our reports to each of our clients’ requirements. The Facebook metrics that we include in our reports need to be a true reflection of what is important to a particular business and its performance.
This article will go through some of the most common Facebook metrics that we include in our social media reports.

Post Performance KPIs
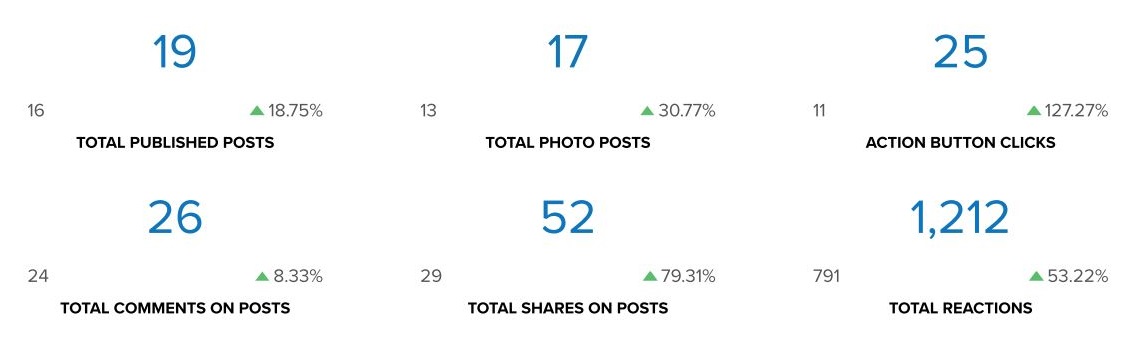
Total Published Posts
The total number of posts that were published.
Total Photo Posts
The total number of photo posts that were published. Facebook is a visual medium so photo posts tend to be the best way to communicate with your target audience. Facebook is also pushing its videos, with videos being able to garner more reach recently. The majority of our social media posts are still image posts though since videos can be quite expensive.
Action Button Clicks
The total number of times the action button was clicked. Facebook has introduced various kinds of action buttons, including ‘Learn More’, ‘Shop Now’, ‘Download’ and so on as call-to-actions you can use to get your fans to do something.
Depending on the kind of campaigns that we run during that time period, this metric may increase or decrease. For example, we want more clicks when we are running promotions on an online store or encouraging people to visit our landing page.
Total Comments on Posts
The total number of comments for all the posts that were published in the previous time period. This is usually an important post engagement metric for us. This number typically increases greatly if we run timeline contests during the month. There is no sentiment analysis here; we do not make the distinction whether the comment was positive or negative.
Total Shares on Posts
The total number of post shares we received in the reporting time period. Shares help amplify the reach of our content and are also an important post engagement metric.
Total Reactions
The total number of reactions (‘Happy’, ‘Sad’, ‘Angry’ etc) we received. If need be, we can break it down into the various reactions but so far we have not found that to be especially useful.
Brand Awareness KPIs
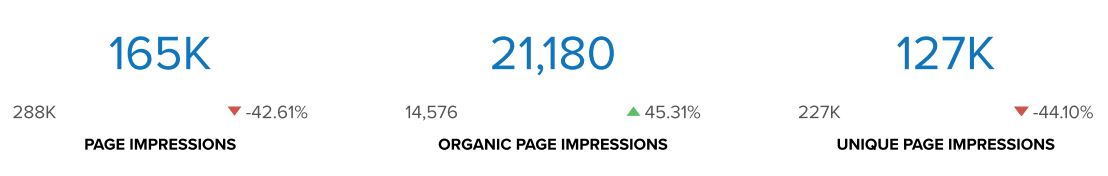
Page Impressions
The total number of times our page is displayed, regardless of whether it was clicked or not. This gives you an idea of the number of times our content was exposed in Facebook’s News Feed. This KPI includes both paid impressions and organic impressions.
Organic Page Impressions
The total number of times our page was displayed organically i.e. without being paid for. If you look at the difference in the numbers in the screenshot above, it becomes clear that Facebook is now pay-to-play. At the same time, we do like to think that the more engaged our audience is, the better our organic reach (although it is still a pale shadow of what you can achieve with just a little advertising budget).
Unique Page Impressions
Some of you might have also seen the metric ‘Reach’ and are wondering what is the difference between Impressions and Reach. Where Impressions refer to the number of times our content was displayed, Reach refers to the number of people who were exposed to our content.
Consider if our content was exposed 100 times on the News Feed, but was only seen by 60 people. That means that we will have an Impression of 100 and a reach of 60.
In our reports, we call it Unique Page Impressions.
Engagement KPIs
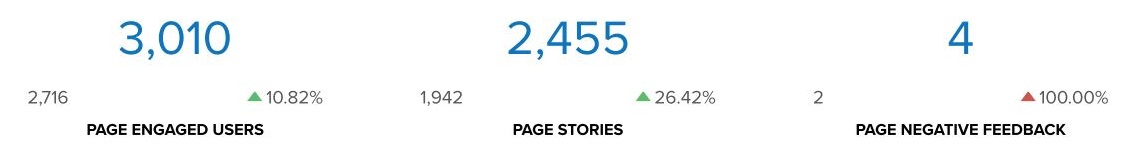
Page Engaged Users
The total number of unique users who clicked anywhere on our posts. Engagement includes any click or story created. This is one of the most important metrics because it measures how engaged our audience base is with our content. The more engaged they are, the better our posts will perform in the News Feed.
Page Stories
A page story is any action a user takes with a post that someone else might see. Stories are a great way for your fans to help organically promote your page or post to others. Actions that may result in a page story include sharing a post, commenting on a post or your page, reacting to a post, tagging your page in a photo and so on.
Page Negative Feedback
There are four kinds of actions that are included in this Facebook metric – Page Unlikes, Spam Reports, Post Hides and Hides of All Posts. Our clients tend not to pay too much attention to this as it’s not as sexy a metric as Page Likes or Engaged Users. But it is still an important metric to keep track. You want to be on top of the situation in case something bad happens.
Fan Base KPIs
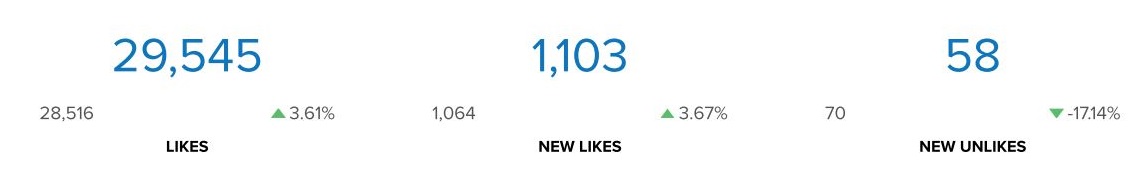
Likes
The total number of page likes you have. Of course, this is the ‘sexiest’ number for most managers; maybe because it is so easy to understand. But you should bear in mind that the typical post reach is now only between 1%-5% of your fans. That means given a page of 100 fans, any particular post will only be exposed to between 1 to 5 fans. You need to pay to boost your visibility if you want to reach the rest.
New Likes
The total number of new page likes you received. We do not make the distinction between Paid and Organic paid likes.
New Unlikes
This Facebook metric is a subset of Page Negative Feedback and reports how many people unliked the page in the given time period.
What are your most important Facebook metrics?
These are the typical Facebook metrics that we include in our reports. Which ones do you track? Share with us in the comments below.